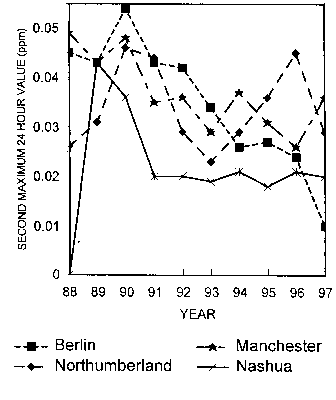
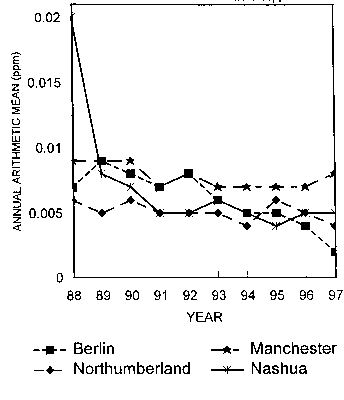
Annual average sulfur dioxide (SO2) concentration in ppm for sites in New Hampshire. The annual average SO2 standard is 0.03 ppm.
| MAX 24-HR | MAX 3-HR | MAX 1-HR | ||||||||||||||||
|---|---|---|---|---|---|---|---|---|---|---|---|---|---|---|---|---|---|---|
| Site ID | P O C | M T | City | County | Address | YR | REP ORG | # OBS | 1ST | 2ND | OBS > ST | 1ST | 2ND | OBS > ST | 1ST | 2ND | ARITH MEAN | METH |
| 33-005-0007 | 1 | 2 | Keene | Cheshire | Railroad Street | 97 | 001 | 8211 | 0.024 | 0.022 | 0 | 0.053 | 0.038 | 0 | 0.055 | 0.053 | 0.007 | 23 |
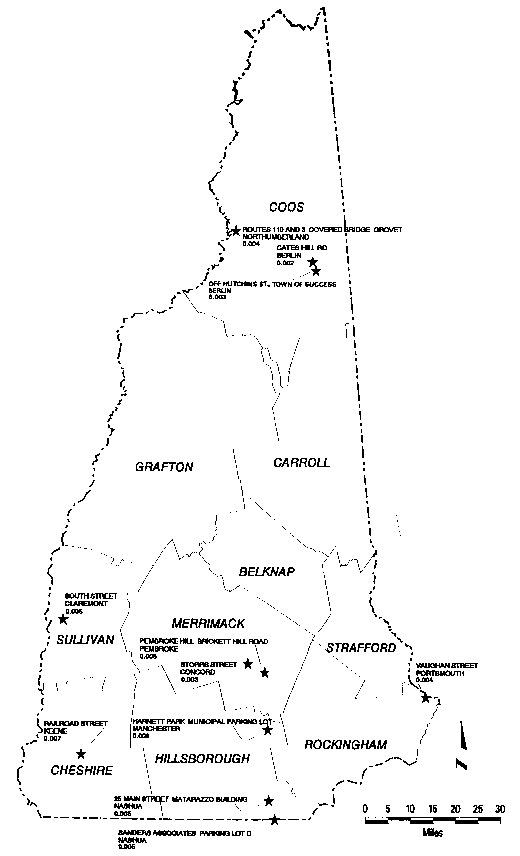
| 33-007-0019 | 1 | 2 | Berlin | Coos | Cates Hill Road | 97 | 902 | 8718 | 0.011 | 0.01 | 0 | 0.054 | 0.027 | 0 | 0.084 | 0.055 | 0.002 | 20 |
| 33-007-0022 | 1 | 2 | Berlin | Coos | Off Hutchins St, Town of Success | 97 | 902 | 8578 | 0.014 | 0.012 | 0 | 0.044 | 0.039 | 0 | 0.059 | 0.058 | 0.003 | 20 |
| 33-007-1007 | 1 | 2 | Northumberland | Coos | Routes 110 & 3 covered bridge grovet | 97 | 004 | 8325 | 0.056 | 0.029 | 0 | 0.132 | 0.102 | 0 | 0.158 | 0.149 | 0.004 | 23 |
| 33-011-0016 | 1 | 1 | Manchester | Hillsborough | Harnett Park, municipal parking lot | 97 | 001 | 8577 | 0.038 | 0.036 | 0 | 0.079 | 0.078 | 0 | 0.102 | 0.092 | 0.008 | 23 |
| 33-011-1009 | 1 | 2 | Nashua | Hillsborough | 25 Main Street, Matarazzo building | 97 | 001 | 8474 | 0.047 | 0.02 | 0 | 0.073 | 0.072 | 0 | 0.073 | 0.073 | 0.005 | 23 |
| 33-011-1010 | 1 | 2 | Nashua | Hillsborough | Sanders Associates parking lot D | 97 | 001 | 8554 | 0.02 | 0.019 | 0 | 0.047 | 0.034 | 0 | 0.061 | 0.048 | 0.005 | 23 |
| 33-013-0007 | 1 | 2 | Concord | Merrimack | Storrs Street | 97 | 001 | 8162 | 0.016 | 0.016 | 0 | 0.064 | 0.057 | 0 | 0.144 | 0.078 | 0.003 | 23 |
| 33-013-1003 | 1 | 2 | Pembroke | Merrimack | Pembroke Hill, Brickett Hill Road | 97 | 001 | 8554 | 0.054 | 0.053 | 0 | 0.163 | 0.13 | 0 | 0.287 | 0.224 | 0.005 | 23 |
| 33-015-0009 | 1 | 2 | Portsmouth | Rockingham | Vaughan Street | 97 | 001 | 8487 | 0.021 | 0.018 | 0 | 0.059 | 0.055 | 0 | 0.11 | 0.088 | 0.004 | 23 |
| 33-019-0003 | 1 | 2 | Claremont | Sullivan | South Street | 97 | 001 | 8536 | 0.024 | 0.019 | 0 | 0.054 | 0.049 | 0 | 0.058 | 0.056 | 0.005 | 23 |